HelioFluxSCIENCE / RESEARCH & EVIDENCE

THE RESEARCH RECORD

Over 100 years of
scientific evidence.

Follow the discoveries, experiments and original papers behind biophoton science.

IN NATUREBiophoton science in the spotlight

Every discovery is shown below. Open What the study shows for the findings, context and original papers.

Origins & debate

1923–1953
1923

Historical hypothesis

A question begins with two onion roots

Gurwitsch reported more cell division on the side of one onion root facing another. He proposed that invisible light caused the effect—an early hypothesis based on cell behavior, not a direct measurement of light.

ILLUSTRATING THE IDEA1923
Compared

Cell division on the left (facing) and right (opposite) sides of the receiving root.

Reported

More division on the side facing the neighboring root.

Scientific source ↗
What the study showsFindings, context & original papersExplore studyClose details
The finding
A reported change in cell division suggested a possible influence between physically separated tissues.
Why it matters
The starting point for the historical research program that later developed into ultraweak-photon-emission studies.
Study context
An early biological effect is not direct photon counting. Later measurements of UPE do not retroactively prove Gurwitsch's proposed mitosis-triggering mechanism.
Read the original
[1] Die Natur des spezifischen Erregers der ZellteilungPublisher metadata verified; original full text requires access. Publisher dates publication to March 1923.
[2] Revisiting the mitogenetic effect of ultra-weak photon emissionOpen full text; historical review, not the original 1923 experiment. Used to describe the historical arrangement.
Reading the illustration

Two roots · a biological assay

  • Compared: Cell division on the left (facing) and right (opposite) sides of the receiving root.
  • Reported: More division on the side facing the neighboring root.

Gurwitsch compared opposite sides of the same receiving root and reported more cell division on the side facing its neighbor. Scientific source ↗
1934

Measurement

An early test finds no signal

Lorenz tested the early radiation claim with calibrated detectors but found no signal under those conditions. His work showed why faint-light experiments need careful checks against detector noise and misleading effects.

ILLUSTRATING THE EXPERIMENT1934
Careful controls

Check the detector against known light and its own background.

No signal found

Under the conditions tested.

Scientific source ↗
What the study showsFindings, context & original papersExplore studyClose details
The finding
No signal was detected from the tested biological sources within the method's stated sensitivity and spectral conditions.
Why it matters
Established the need for detector calibration, artifact control, and independent replication.
Study context
A null result with an early UV-sensitive detector is not proof that all biological photon emission is absent at every wavelength or intensity.
Read the original
[3] Search for Mitogenetic Radiation by Means of the Photoelectric MethodPublisher abstract verified; full-text scan also available at https://pmc.ncbi.nlm.nih.gov/articles/PMC2141317/.
[4] The Present Status of Mitogenetic RadiationPublisher abstract and metadata; contemporary review, not an additional experiment.
[5] Mitogenetic RadiationPublisher abstract and metadata verified. Historical perspective describes the negative 1930s work and renewed later interest; full text requires access.
Reading the illustration

Biological sources · calibrated detection

  • Test: Look for the proposed radiation while checking detector background.
  • Result: No detectable signal under the conditions tested.

Lorenz detected no mitogenetic radiation from the tested sources within his method’s sensitivity and spectral conditions. Scientific source ↗

1951

Measurement

Plants reveal a measurable afterglow

Green plants kept giving off faint light for minutes after illumination stopped. This afterglow was linked to photosynthesis. It is a related phenomenon called delayed luminescence, distinct from light emitted without recent illumination.

ILLUSTRATING THE EXPERIMENT1951
01 · Illuminate

Expose the plant to light.

02 · Switch off

Stop the illumination.

03 · Measure

Detect the delayed afterglow.

Scientific source ↗
What the study showsFindings, context & original papersExplore studyClose details
The finding
Previously illuminated green plants emitted delayed light with properties linked to photosynthetic processes.
Why it matters
Demonstrated that sensitive optical measurements can report biological chemistry, while highlighting a major background signal that later UPE experiments must control.
Study context
This is light-induced delayed luminescence, not evidence of spontaneous emission without prior illumination or of intercellular signaling.
Read the original
[6] Light Production by Green PlantsOpen article abstract and full-text scan.
Reading the illustration

Plant tissue · delayed luminescence

  • 01 · Illuminate: Expose the plant to light.
  • 02 · Switch off: Stop the illumination.
  • 03 · Measure: Detect the delayed afterglow.

Previously illuminated plants emitted delayed light linked to photosynthetic chemistry. Scientific source ↗

Measuring the light

1954–1989
1954

Measurement

Sensitive detectors measure light from seedlings

Colli and Facchini used sensitive instruments to detect faint light from germinating plants. The question could now be studied by measuring light directly, rather than inferring its presence from changes in cell division.

ILLUSTRATING THE EXPERIMENT1954
Biological source

Weak visible light from germinating plants.

Direct measurement

An instrument detects the emitted light.

Scientific source ↗
What the study showsFindings, context & original papersExplore studyClose details
The finding
Weak visible emission from germinating plants became accessible to direct instrumental measurement.
Why it matters
An early bridge from disputed biological detectors to the photon-measurement tradition of modern UPE research.
Study context
Plant emission does not establish mitogenetic signaling. Sample preparation, illumination history, chemistry and detector background all affect interpretation.
Read the original
[7] Light emission by germinating plantsPublisher metadata verified; full text requires access. Methodological context corroborated by the 1955 follow-up and later scholarly histories.
[8] Further measurements on the bioluminescence of the seedlingsPublisher metadata and original Italian summary verified; full text requires access. The historical term bioluminescence in this title refers to the reported faint seedling emission.
Reading the illustration

Germinating plants · photoelectric measurement

  • Biological source: Weak visible light from germinating plants.
  • Direct measurement: An instrument detects the emitted light.

Photoelectric measurements established weak visible emission from germinating plants as a physical signal. Scientific source ↗

1972

Mechanism

Human immune cells emit light while engulfing targets

Human immune cells studied in the laboratory emitted faint light while engulfing targets. The observation connected biological light with the reactive chemistry cells use during an immune response.

ILLUSTRATING THE EXPERIMENT1972
Cell activity

Immune cells engulf their targets.

Optical readout

Oxidative reactions accompany measurable light emission.

Scientific source ↗
What the study showsFindings, context & original papersExplore studyClose details
The finding
Activated human immune-cell preparations produced measurable chemiluminescence during phagocytosis.
Why it matters
Linked biological light emission to oxidative immune-cell activity and motivated subsequent mechanistic work.
Study context
The original proposed role of singlet oxygen was an interpretation. It should not be presented as proving a universal light-based communication system or a clinical cancer assay.
Read the original
[9] Evidence for the generation of an electronic excitation state(s) in human polymorphonuclear leukocytes and its participation in bactericidal activityPubMed metadata verified. Original abstract available on an author-deposited copy at https://www.researchgate.net/publication/18143103_Evidence_of_the_generation_of_an_electronic_excitation_states_in_human_polymorphonuclear_leukocytes_and_its_participation_in_bactericidal_activity; publisher full text not accessed.
Reading the illustration

Immune-cell chemistry · isolated human cells

  • Cell activity: Immune cells engulf their targets.
  • Optical readout: Oxidative reactions accompany measurable light emission.

Isolated human immune cells produced chemiluminescence while engulfing targets. Scientific source ↗

1974

Measurement

Yeast light changes as the culture grows

A sensitive detector measured faint light from growing yeast cultures. The signal changed with the culture’s growth stage, showing that emission can vary with biological activity—not just whether living cells are present.

ILLUSTRATING THE EXPERIMENT1974
While growing

Faint light was detected.

As growth slowed

The emission pattern changed.

Scientific source ↗
What the study showsFindings, context & original papersExplore studyClose details
The finding
Saccharomyces cerevisiae cultures exhibited growth-stage-dependent photon emission.
Why it matters
Showed that the timing of emission can contain information about a biological process, beyond the simple presence of light.
Study context
Culture-to-culture variability was substantial. Association with growth does not establish a causal photon signal between cells.
Read the original
[10] Weak luminescence from the yeast Saccharomyces cerevisiae and the existence of mitogenetic radiationPublisher abstract verified; full text requires access.
Reading the illustration

Yeast cultures · two growth stages

  • Late logarithmic phase: The culture is still growing.
  • Early stationary phase: Growth slows; the emission pattern changes.

Yeast cultures showed different emission patterns during late logarithmic and early stationary growth. Scientific source ↗

1980

Mechanism

Light reflects chemical changes in liver tissue

Experiments in rat livers linked faint light to reactions involving oxygen. Adding chemicals that promote oxidation increased the emission, helping explain how ordinary tissue chemistry can produce a measurable light signal.

ILLUSTRATING THE EXPERIMENT1980
Before treatment

A faint baseline signal.

More oxidation

More light was measured.

Scientific source ↗
What the study showsFindings, context & original papersExplore studyClose details
The finding
Rat-liver light emission increased with experimentally induced oxidative reactions.
Why it matters
Grounded UPE measurement in testable biochemistry and the study of oxidative stress.
Study context
The liver was experimentally exposed or perfused; noninvasive optical readout here does not mean a validated through-skin human diagnostic procedure.
Read the original
[11] Organ chemiluminescence: noninvasive assay for oxidative radical reactionsPubMed abstract verified; open full-text scan at https://pmc.ncbi.nlm.nih.gov/articles/PMC348267/.
Reading the illustration

Oxidative chemistry · rat-liver experiments

  • Before challenge: Spontaneous emission from liver preparations.
  • After hydroperoxide: Oxidative reactions increase the emission.

Hydroperoxide treatment increased light from rat liver preparations, supporting an oxidative chemical origin. Scientific source ↗

1984

Hypothesis

Popp proposes a more organized kind of light

Popp and colleagues suggested that DNA might help produce coordinated light waves. This influential proposal went beyond detecting faint light: it was an explanation to test, not an established property of biological emission.

ILLUSTRATING THE IDEA1984
DNA connection

A proposed explanation for the light.

Coordinated light waves

A hypothesis, not an established finding.

Scientific source ↗
What the study showsFindings, context & original papersExplore studyClose details
The finding
The authors reported optical observations and advanced a DNA-related coherence model.
Why it matters
Expanded the research questions from photon quantity to photon statistics, sources and possible organization.
Study context
A 2015 critical review found UPE well established but no reliable evidence then for coherence or nonclassical light. Do not label Popp's model as settled fact or as necessary for HelioFlux's measurement rationale.
Read the original
[12] Biophoton emission. New evidence for coherence and DNA as sourcePublisher abstract and metadata verified; full text requires access.
[13] Biophotons, coherence and photocount statistics: A critical reviewOpen author manuscript of the published critical review. Its conclusion is dated 2015, not an assertion that every later claim was assessed.
Reading the illustration

Historical interpretation · not a settled mechanism

  • Observation: Photon-count patterns, spectra and light-induced decay.
  • Proposed explanation: Popp interpreted them through a DNA-related coherence model.

Popp interpreted optical observations through a DNA-related coherence model; the interpretation remains distinct from measuring UPE. Scientific source ↗

1988

Mechanism

Oxygen and growth change bacterial light

Bacterial cultures produced different light spectra at different growth stages. Without oxygen, no signal was detected under the tested conditions—further evidence connecting emission with oxygen-related chemistry.

ILLUSTRATING THE EXPERIMENT1988
Growing + oxygen

Ultraviolet and visible light.

Growth slowed + oxygen

Visible light.

No oxygen

No light detected in this test.

Scientific source ↗
What the study showsFindings, context & original papersExplore studyClose details
The finding
Emission spectrum changed with growth stage, and the measured signal was oxygen-dependent.
Why it matters
Demonstrated why spectra, timing and controls can be more informative than a single total-brightness value.
Study context
The proposed chemical origin of the ultraviolet component was tentative. This bacterial culture experiment is not evidence of human cancer detection.
Read the original
[14] Spectral and time dependence studies of the ultra weak bioluminescence emitted by the bacterium Escherichia coliPublisher abstract and metadata verified; full text may require access.
Reading the illustration

E. coli cultures · an oxygen control

  • Growing + oxygen: Ultraviolet and visible emission.
  • Stationary + oxygen: Visible emission.
  • Without oxygen: No light detected under the tested conditions.

E. coli cultures emitted detectable light with oxygen but not without it under the tested conditions; wavelengths also varied with growth stage. Scientific source ↗

1989

Measurement

Images show where a plant’s faint light comes from

Researchers imaged germinating plants using their own faint light. The strongest signals came from actively dividing regions. The images showed where emission occurred, not just the total amount a detector could count.

ILLUSTRATING THE EXPERIMENT1989
Measured

Images recorded where plant photons came from.

Located

Stronger emission in actively dividing regions.

Scientific source ↗
What the study showsFindings, context & original papersExplore studyClose details
The finding
Single-photon-counting imaging revealed spatial patterns in naturally emitted plant light.
Why it matters
A landmark in turning UPE from an aggregate count into biological imaging.
Study context
A brighter region associated with division does not establish that photons trigger division. A photon-counting image is an instrument-produced map, not a naked-eye view.
Read the original
[15] Ultraweak emission imagery of mitosing soybeansPublisher abstract and author metadata verified directly; full text requires access. Some secondary reference lists omit M. Usa, but the publisher lists all three authors.
Reading the illustration

Germinating plants · spatial emission

  • Measured: Images recorded where plant photons came from.
  • Located: Stronger emission in actively dividing regions.

Photon-counting images of germinating plants showed strongest emission in regions of active cell division. Scientific source ↗

Making it visible

1990–2009
1998

Cell study

Faint light tracks cancer-cell growth in the lab

Researchers followed one human esophageal cancer-cell culture for 93 hours. Its light signal changed alongside cell growth, without an added light-producing label. The study concerned cells in a laboratory, not cancer detection in people.

ILLUSTRATING THE EXPERIMENT1998
Culture growth

The number of cells changes over time.

Photon emission

The light follows a similar time course; cell number matters.

Scientific source ↗
What the study showsFindings, context & original papersExplore studyClose details
The finding
Emission tracked the growth of the TE9 cell culture and was strongly influenced by the number of cells.
Why it matters
An early bridge from detecting light to asking whether it contains useful cancer-research information.
Study context
One cultured carcinoma line; no patient screening, tumor specificity, sensitivity, or clinical accuracy was established.
Read the original
[16] A novel method of assessing carcinoma cell proliferation by biophoton emissionPrimary abstract verified; full article not reviewed.
Reading the illustration

TE9 flow culture · 93 hours of observation

  • Culture growth: The number of cells changes over time.
  • Photon emission: The light follows a similar time course; cell number matters.

In TE9 carcinoma cultures, emission followed a time course similar to growth and was strongly influenced by cell number. Scientific source ↗

1999

Animal study

Imaging light from the living rat brain

Sensitive instruments imaged faint light from the living rat brain. In separate brain-slice experiments, changing the cells’ energy supply changed the signal—connecting the light to tissue chemistry and energy use.

ILLUSTRATING THE EXPERIMENT1999
Living rat brain

Emission varied with physiological activity.

Separate brain slices

Removing glucose reduced emission.

Scientific source ↗
What the study showsFindings, context & original papersExplore studyClose details
The finding
Brain emission varied with physiological activity; slice experiments supported a mitochondrial and reactive-oxygen contribution.
Why it matters
A foundation for later studies asking what spontaneous light reveals about neural tissue.
Study context
Animal and brain-slice experiments do not establish a noninvasive human brain test or photon-based neural communication.
Read the original
[17] In vivo imaging of spontaneous ultraweak photon emission from a rat’s brain correlated with cerebral energy metabolism and oxidative stressPrimary publisher abstract verified; full article not reviewed.
Reading the illustration

Two experimental preparations

  • Living rat brain: Emission varied with physiological activity.
  • Separate brain slices: Removing glucose reduced emission.

Rat-brain imaging and separate brain-slice interventions linked emission with physiology and energy metabolism. Scientific source ↗

2004

Animal study

Tumors in mice are imaged using their own light

Researchers imaged transplanted tumors in mice without an added light-producing label. Patterns of faint light were linked to tumor growth and the condition of the tissue. This was animal research, not human screening.

ILLUSTRATING THE EXPERIMENT2004
Photon images

Researchers recorded the tumor’s faint emission.

Tissue comparison

Emission patterns were linked with growth and viable tissue.

Scientific source ↗
What the study showsFindings, context & original papersExplore studyClose details
The finding
Sequential tumor images and tissue comparisons linked emission to growth and viability in mouse tumor models.
Why it matters
An early preclinical demonstration of spatially resolved cancer-related UPE.
Study context
Transplanted mouse tumors are not human screening. Correlation with tumor size is not diagnostic sensitivity or specificity.
Read the original
[18] Biophoton detection as a novel technique for cancer imagingPrimary abstract and selected original paper text verified. PubMed journal issue is August2004; later online/PMC date should not replace publication year.
Reading the illustration

Mouse model · tumor growth and tissue viability

  • Photon images: Researchers recorded the tumor’s faint emission.
  • Tissue comparison: Emission patterns were linked with growth and viable tissue.

Emission patterns from transplanted mouse tumors were linked with tumor growth and microscopic tissue viability. Scientific source ↗

2009

Human measurement

The human body’s faint light is photographed

A highly sensitive camera photographed faint light from five healthy men. The signal varied across the body and through the day, tending to peak in late afternoon. It was too faint to see with the naked eye.

ORIGINAL RESEARCH FIGUREFIGURE 1

C–G: photon intensity across the day · I: a separate thermal image

Human photon emission changes through the day. In five healthy men, 20-minute exposures revealed a signal that varied with time of day. Figure 1 · Original paper ↗© 2009 Kobayashi, Kikuchi and Okamura · CC BY
What the study showsFindings, context & original papersExplore studyClose details
The finding
Spontaneous human emission showed a daily rhythm under controlled laboratory conditions.
Why it matters
Direct human measurement, with images, experimental conditions and quantitative analysis available for inspection.
Study context
Five healthy men in their 20s; no disease detection or general-population diagnostic performance was tested.
Read the original
[19] Imaging of Ultraweak Spontaneous Photon Emission from Human Body Displaying Diurnal RhythmOpen access; full primary text and figure captions verified.

Reading the patterns

2010–2022
2011

Mechanism

Changing the chemistry changes the light

In algae, increasing oxidation strengthened the light, while removing oxygen reduced it. In separate human-skin experiments, antioxidants or less oxygen also reduced emission—linking the signal to specific chemical reactions.

ORIGINAL RESEARCH FIGUREFIGURE 1

A–D grid: top intact · bottom disrupted · left no added fatty acid · right added fatty acid

A–D compare intact and disrupted algae, with and without added linoleic acid. Emission is strongest in disrupted cells with added fatty acid (D). E is an ordinary photograph. Figure 1 · Original paper ↗© 2011 Ankush Prasad and Pavel Pospíšil · CC BY
What the study showsFindings, context & original papersExplore studyClose details
The finding
Controlled chemical interventions supported a substantial role for oxidative reactions in producing UPE.
Why it matters
Mechanistic evidence helps explain why photons can reflect metabolic and stress-related processes.
Study context
The algae and skin experiments are distinct models. Their findings do not make brightness a universal measure of health or disease.
Read the original
[20] Linoleic Acid-Induced Ultra-Weak Photon Emission from Chlamydomonas reinhardtii as a Tool for Monitoring of Lipid Peroxidation in the Cell MembranesOpen access; full primary text, captions and license verified.
[21] Spontaneous ultraweak photon emission imaging of oxidative metabolic processes in human skin: effect of molecular oxygen and antioxidant defense systemPrimary abstract verified; article is marked free, but image reuse permission not verified.
2014

Review

A review brings together 56 human studies

A review gathered 56 studies measuring faint light in people and human samples. It mapped a growing research field and gaps in how studies were run, rather than validating a particular medical test.

ILLUSTRATING THE REVIEW2014
Scientific source ↗
What the study showsFindings, context & original papersExplore studyClose details
The finding
The review included 1 randomized trial, 27 controlled clinical trials and 28 observational or descriptive studies across diverse questions.
Why it matters
Shows that human UPE measurement was already a multi-study research area, not a single isolated report.
Study context
Study count is not a pooled diagnostic-performance result. Heterogeneous studies do not validate a specific cancer test.
Read the original
[22] Ultraweak Photon Emission as a Non-Invasive Health Assessment: A Systematic ReviewOpen access; abstract, inclusion numbers and license verified from PubMed/PMC.
Reading the illustration

Human photon research · whole-body and sample-based studies

  • 1: Randomized trial
  • 27: Controlled clinical trials
  • 28: Observational or descriptive studies

The 2014 systematic review included 56 human studies with varied methods and study designs. Scientific source ↗

2014

Cell studyNIROSHA MURUGAN · Co-author

Stressed cells show a changing light pattern

Dotta, Murugan and colleagues followed stressed melanoma-cell cultures for 24 hours using wavelength filters. Different wavelength bands peaked at different times, suggesting that timing and wavelength could add information beyond brightness alone.

ILLUSTRATING THE EXPERIMENT2014
Across 24 hours

Different wavelength bands peaked at different times.

Beyond brightness

Which light was measured mattered too.

Scientific source ↗
What the study showsFindings, context & original papersExplore studyClose details
The finding
Emission patterns changed over time in stressed melanoma cultures; chemical treatments modulated selected wavelength bands.
Why it matters
Connected photon measurements with changing cellular conditions and motivated wavelength-resolved research.
Study context
A cultured-cell experiment, not a diagnostic test. The proposed resonant-recognition and cell-communication interpretations are hypotheses, not established by emission measurements alone. Publisher abstract verified; full text is subscription-access.
Read the original
[23] Shifting wavelengths of ultraweak photon emissions from dying melanoma cells: their chemical enhancement and blocking are predicted by Cosic’s theory of resonant recognition model for macromoleculesPublisher abstract and PubMed verified; subscription full text
Reading the illustration

Stressed melanoma cultures · 24-hour observation

  • Earlier · 950 nm: Near-infrared wavelengths
  • Next · 370 nm: Near-ultraviolet wavelengths
  • Later · 400–800 nm: Visible wavelengths

Stressed melanoma cultures emitted different wavelength bands as the experiment progressed. Scientific source ↗

2015

Review

A review separates measurements from bigger claims

This review found biological light emission well established, but no reliable evidence in the studies reviewed for stronger claims about coordinated light waves or unusual quantum behavior.

ILLUSTRATING THE REVIEW2015
Faint light exists

Supported by experiments.

Coordinated light waves

Not reliably demonstrated in the research reviewed.

Scientific source ↗
What the study showsFindings, context & original papersExplore studyClose details
The finding
The authors supported UPE as a measured phenomenon while challenging stronger statistical and quantum interpretations.
Why it matters
An essential guardrail against presenting all biophoton hypotheses as equally established science.
Study context
This is a 2015 assessment, not proof that no later experiment could change the evidence. New claims require their own review.
Read the original
[13] Biophotons, coherence and photocount statistics: A critical reviewPrimary publisher abstract and introduction verified; author manuscript available at https://arxiv.org/abs/1502.07316 .
Reading the illustration

Detecting photons and establishing coherence are different questions

  • Biological emission: Its existence is experimentally established.
  • Coherence / nonclassical light: Reliable evidence was lacking in the literature reviewed.

The 2015 critical review accepted UPE as established but found reliable evidence for coherence or nonclassical light lacking. Scientific source ↗

2017

Cell study

Chemical stress increases light from cultured cells

Adding hydrogen peroxide to cultured colon-cancer cells increased their faint light. The response depended on concentration and recording time, showing how a controlled chemical stress can change the signal in a laboratory model.

ILLUSTRATING THE EXPERIMENT2017
Untreated culture

Baseline emission.

Hydrogen peroxide

Emission increases; dose and measurement time matter.

Scientific source ↗
What the study showsFindings, context & original papersExplore studyClose details
The finding
Hydrogen-peroxide exposure increased recorded UPE in a cultured colon-cancer cell line.
Why it matters
Independent support for using UPE to study oxidative responses in cancer-cell research.
Study context
One cell line and an externally induced stressor; no clinical detection performance or universal cancer-brightness rule.
Read the original
[24] Detection of Ultraweak Photon Emission (UPE) from Cells as a Tool for Pathological StudiesFull primary text and license verified via Europe PMC XML; publication date December1,2017, not2018 despite later PubMed indexing. No DOI is present in archived article metadata.
Reading the illustration

HT-29 cell cultures · oxidative challenge

  • Untreated culture: Baseline emission.
  • Hydrogen peroxide: Emission increases; dose and measurement time matter.

Hydrogen-peroxide exposure increased emission in cultured HT-29 colon-cancer cells, with dose- and time-dependent responses. Scientific source ↗

2017

Mechanism

Light changes alongside cell chemistry

Researchers measured faint light and chemical changes in the same laboratory model of immune-cell activity. Blocking part of the oxygen-related response reduced emission, linking the light to an independently measured process.

ILLUSTRATING THE EXPERIMENT2017
Two measurements

Light and cell chemistry changed together.

Testing the connection

Blocking an oxygen-related reaction reduced the light.

Scientific source ↗
What the study showsFindings, context & original papersExplore studyClose details
The finding
UPE, NADPH-oxidase activity and intracellular metabolic changes were linked in this controlled cell model.
Why it matters
An example of validating the meaning of the optical signal against a second measurement technology.
Study context
A manipulated cell model is not a clinical diagnostic study; emitting species and broader applications still require further tests.
Read the original
[25] Ultra-weak photon emission as a dynamic tool for monitoring oxidative stress metabolismOpen access; primary results, captions and CC BY4.0 license verified through publisher and Europe PMC XML.
Reading the illustration

Matched culture conditions · optical and chemical analysis

  • Linked changes: Photon signals and cell metabolites changed together.
  • Mechanism test: Blocking NADPH oxidase reduced induced emission.

In differentiated HL-60 cells, optical and metabolic changes were linked; blocking NADPH oxidase reduced induced emission. Scientific source ↗

2018

Cell studyNIROSHA MURUGAN · First and corresponding author

Wavelength matters—not just brightness

Murugan’s team compared six laboratory cell lines using filters for different parts of the light spectrum. Selected bands and recording periods helped distinguish some cell groups where brightness alone did not. This was not a test validated in patients.

ILLUSTRATING THE EXPERIMENT2018
Unfiltered light

Total photon counts did not separate the groups well.

Selected wavelengths

Specific bands and time windows improved group separation.

Scientific source ↗
What the study showsFindings, context & original papersExplore studyClose details
The finding
Selected wavelength filters improved separation of cultured-cell groups.
Why it matters
Tested spectral and temporal features as candidate indicators of cell state.
Study context
The frequently quoted 92% classification was obtained only after removing HBL100 cells from the analysis. It is not clinical accuracy, sensitivity or specificity; the cell models and exclusions materially affect interpretation.
Read the original
[27] Biophotonic markers of malignancy: Discriminating cancers using wavelength-specific biophotonsFull text verified through Europe PMC JATS
Reading the illustration

Six cell lines · one filter per run · detector below the dish

  • Unfiltered light: Total photon counts did not separate the groups well.
  • Selected wavelengths: Specific bands and time windows improved group separation.

Selected wavelength bands separated the study’s cultured-cell groups better than unfiltered photon counts. Scientific source ↗

2020

Cell studyNIROSHA MURUGAN · First author

Short recordings reveal patterns in cells and mice

Murugan’s team studied brief light recordings from cell cultures and, separately, mice in a melanoma experiment. Patterns over time helped distinguish some groups and conditions—laboratory and animal findings, not human diagnostic results.

ORIGINAL RESEARCH FIGUREFIGURE 1

A: live cells · B: UV-killed cells · C: uninjected controls

Mice received live melanoma cells, UV-killed melanoma cells, or no injection. These controls help distinguish tumor-associated changes from effects of injecting cells. Figure 1 · Original paper ↗© 2020 Murugan and colleagues · CC BY 4.0
ORIGINAL RESEARCH FIGUREFIGURE 5

Teal: 24 hours · Orange: 7 days · Olive: 13 days. Each set compares uninjected, tumor and UV-treated groups.

Mean raw photon counts per second in three mouse groups. Both injected groups changed over time; brightness alone did not uniquely identify tumor-bearing mice. Bars show group means with standard errors. Figure 5 · Original paper ↗© 2020 Murugan and colleagues · CC BY 4.0
What the study showsFindings, context & original papersExplore studyClose details
The finding
Temporal photon-count features carried information about selected cell cultures and experimental mouse conditions.
Why it matters
Moves from long recordings toward brief measurements and examines both cell cultures and whole animals.
Study context
The abstract reports 90% cell-culture discrimination, while detailed analyses report approximately 83% for selected comparisons and 70% when pooling cell types. No human diagnostic performance or 90% mouse accuracy was established.
Read the original
[28] Ultraweak Photon Emissions as a Non-Invasive, Early-Malignancy Detection Tool: An In Vitro and In Vivo StudyFull text, methods, results and image license verified through Europe PMC JATS

New frontiers

2023–2026
2025

Animal study

Sensitive cameras reveal changes in biological state

In a mouse study, researchers recorded weaker light after death than during life. The same research found that heat and injury increased light emission in plants.

ILLUSTRATING THE SETUP2025
Sensitive camera

Records faint light in darkness.

Sequential images

Compare the signal at different times.

Scientific source ↗
What the study showsFindings, context & original papersExplore studyClose details
The finding
Imaging distinguished live and recently euthanized mice and detected stress-dependent changes in plants.
Why it matters
A recent instrumental demonstration across both animal and plant systems.
Study context
Small experimental study; not a cancer-detection study, a measure of consciousness, or proof of biological optical communication.
Read the original
[33] Imaging Ultraweak Photon Emission from Living and Dead Mice and from Plants under StressPeer-reviewed abstract verified; experimental detail cross-checked against the author preprint. Publisher Figshare deposit verified at https://acs.figshare.com/articles/journal_contribution/28855832 .
Reading the illustration

Whole-animal imaging · sequential measurements

  • Living mice: Greater photon emission.
  • After euthanasia: Lower emission in the later acquisition.

In the 2025 mouse experiment, living animals emitted more light than the measurements taken after euthanasia. Scientific source ↗

2025

Mechanism

Faint-light images map plant stress

Images showed how plant emission changed under chemical, salt, heat and injury stress. Antioxidants reduced light at treated sites, helping link the visible patterns to oxidation rather than simply showing that plants emit light.

ORIGINAL RESEARCH FIGUREFIGURE 2

Each row pairs an ordinary photograph with its photon image

Ordinary photographs sit beside 30-minute photon images of plants under baseline, oxidative, salt and heat conditions. False colors encode photon intensity. Figure 2 · Original paper ↗© 2024 Ankush Prasad, Eliška Mihačová, Renuka Ramalingam Manoharan and Pavel Pospíšil; published 2025 · CC BY 4.0
What the study showsFindings, context & original papersExplore studyClose details
The finding
Stress changed emission patterns; biochemical interventions and complementary assays supported an oxidative contribution.
Why it matters
Clear, inspectable images demonstrate the link between an experimental perturbation and its optical pattern.
Study context
A laboratory plant study, not a human disease test. Photooxidative conditions must be distinguished from spontaneous dark-adapted emission.
Read the original
[34] Application of ultra-weak photon emission imaging in plant stress assessmentOpen access; full primary text, captions and CC BY4.0 license verified. Published January5,2025;2024 in DOI is not the publication year.
2025

Human measurementNIROSHA MURUGAN · Senior, corresponding and lead-contact author

Recording faint light alongside human brain rhythms

Casey, Murugan and colleagues recorded faint light near the head alongside electrical brain activity in 20 healthy adults. They found some linked patterns, but the exploratory study did not establish which tissues produced the light.

ILLUSTRATING THE EXPERIMENT2025
EEG

Electrical brain activity.

Near-head photon counts

Some timing patterns correlated; the light’s tissue source remains unresolved.

Scientific source ↗
What the study showsFindings, context & original papersExplore studyClose details
The finding
Reported structured photon-count dynamics and some relationships with simultaneously recorded EEG signals.
Why it matters
Extends Murugan’s research from cell and animal models to simultaneous optical and electrical measurements in people.
Study context
Small exploratory study; some analyses used 18 participants. The measurements do not establish whether photons originated in the brain rather than other tissues or background sources. This is not thought-reading, a proven brain-imaging platform, or human cancer validation.
Read the original
[35] Exploring ultraweak photon emissions as optical markers of brain activityFull text, participant methods, limitations, authorship and license verified through Europe PMC JATS
Reading the illustration

20 adults · two measurements recorded together

  • EEG: Electrical brain activity.
  • Near-head photon counts: Some timing patterns correlated; the light’s tissue source remains unresolved.

Some photon-count patterns correlated with EEG activity in this exploratory study; the light’s tissue of origin remains unresolved. Scientific source ↗

2026

Cell study

Different brain-cell cultures, different light patterns

Brain-supporting cells and brain-cancer cells produced detectable light in the lab, with differences in timing and photon counts. Because the cultures started with different numbers of cells, their brightness was not a like-for-like comparison.

ORIGINAL RESEARCH FIGUREFIGURE 2

Green: astrocytes · Red: glioblastoma · Blue: detector background

Both cell cultures had higher average counts than detector background. Starting cell numbers differed, so the two cultures are not a like-for-like brightness comparison. Figure 2 · Original paper ↗© 2026 Luca De Paolis and colleagues · CC BY 4.0
What the study showsFindings, context & original papersExplore studyClose details
The finding
Both culture types emitted detectable light, with different count statistics and temporal structure.
Why it matters
A current example of examining patterns and dynamics rather than relying on brightness alone.
Study context
One 48-hour cycle per culture condition, unequal starting cell counts and no reported per-cell normalization. No patient validation or demonstrated communication mechanism.
Read the original
[36] First Experimental Measurements of Biophotons from Astrocytes and Glioblastoma Cell CulturesPrimary full text, methods, tables and license verified via Europe PMC XML; publication January17,2026.

IN THE SCIENCE PRESS

Nature

BIOPHOTON SCIENCE IN FOCUS

All living things emit a faint glow. Could this light be useful?

Science journalist Jo Marchant reports on biophoton research and its possible applications. This is a Nature news feature, not a new experimental study.

Read the Nature feature

Science journalism, not validation or endorsement of HelioFlux. Full feature may require a subscription.

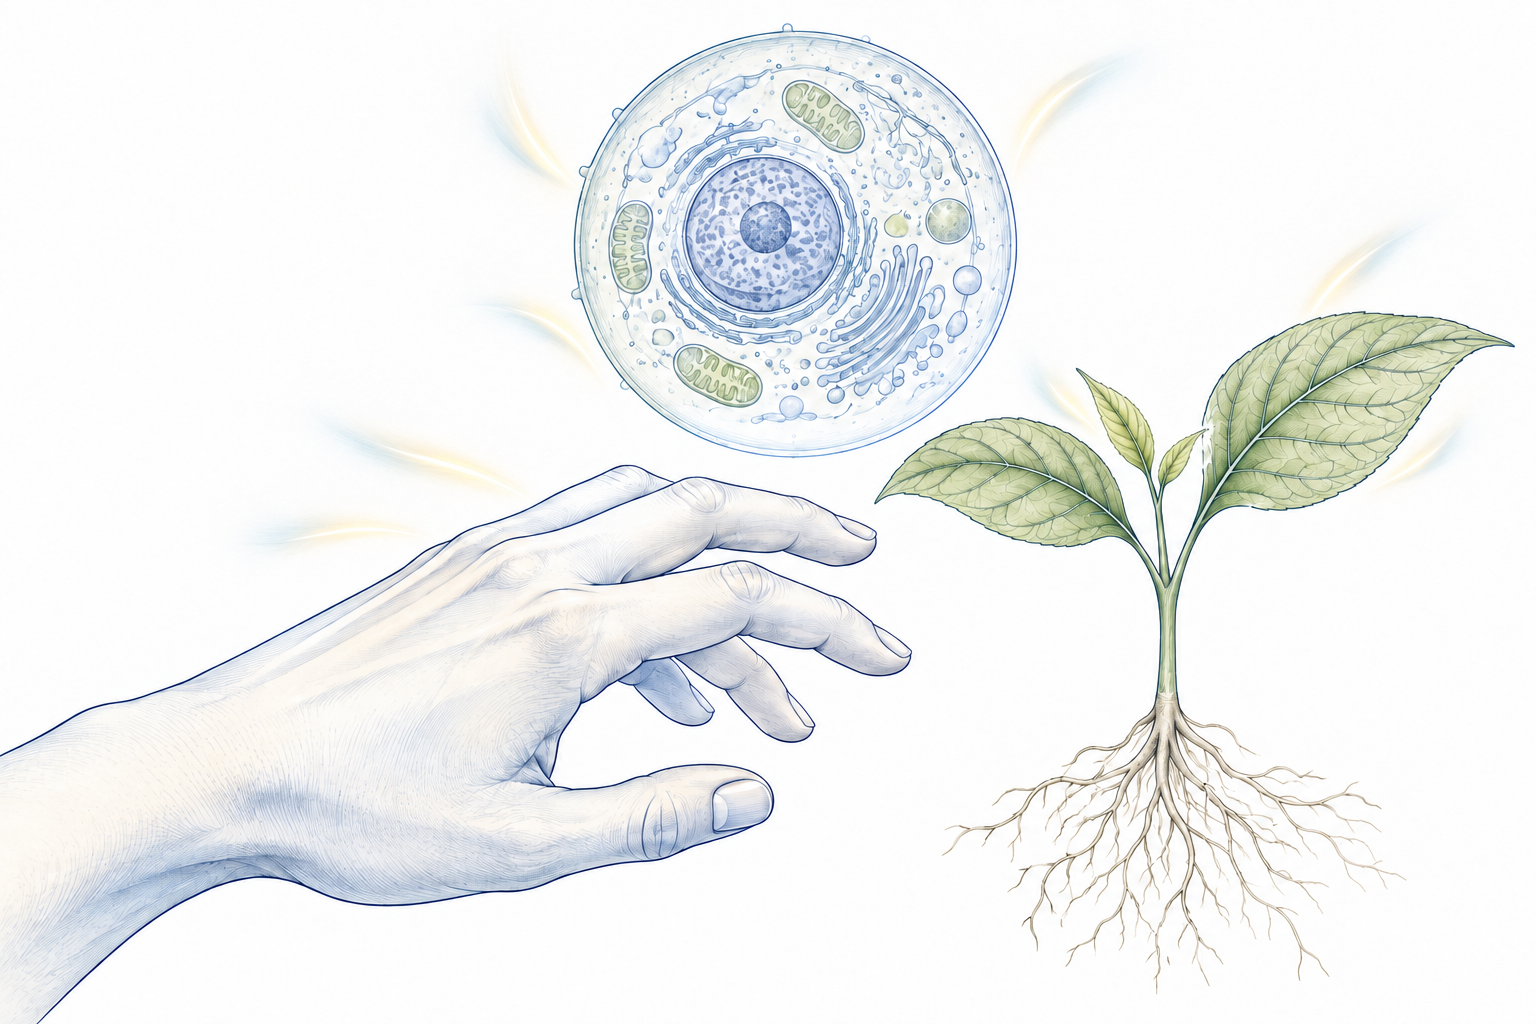
Editorial line drawing of a human hand, a plant and a cell, with soft light accents beside each illustrating ultraweak photon emission.
Illustrating the faint light emitted by living systems. Original artwork for this timeline.

THE NEXT CHAPTER

From a biological signal
to useful information.

Dr. Nirosha Murugan’s research connects several stages of this story: photon patterns in cell cultures, group-level changes in an animal tumor model, and exploratory measurements in healthy people.

Those are distinct achievements. Together they motivate a serious research question: can the signal provide useful information about biological state?

HelioFlux is investigating that question for cancer. The next clinical proof point is measurement in people, matched directly to biopsy results. Human cancer diagnostic performance has not yet been established.

FOLLOW THE EVIDENCE

Sources & image credits.

Original papers are linked at each milestone. This bibliography keeps the record together.

What this evidence meansSCIENCE CONTEXT +

Living cells give off light too faint for our eyes to see. Sensitive instruments can measure it, and experiments connect much of it to ordinary chemical reactions involving oxygen. Scientists call this ultraweak photon emission, or UPE. [Kobayashi 2009]

This timeline follows the evidence: early questions, direct measurements, images and studies of changing biological states. Measuring this light is established; using it to diagnose disease requires its own clinical evidence.

01

Established measurement

Biological photon emission can be detected and recorded under controlled conditions.

02

Active biological research

Researchers study how brightness, wavelengths and timing change with cell activity, stress and disease models.

03

Applications still to be validated

A measurable signal is not automatically a clinical test. Human cancer performance requires its own rigorous validation.

Where HelioFlux fits →
Full bibliography32 sources +
  1. Alexander Gurwitsch (1923). Die Natur des spezifischen Erregers der Zellteilung. Archiv für mikroskopische Anatomie und Entwicklungsmechanik 100:11–40.DOI: 10.1007/BF02111053 · Publisher metadata verified; original full text requires access. Publisher dates publication to March 1923.
  2. Ilya Volodyaev; Lev V. Beloussov (2015). Revisiting the mitogenetic effect of ultra-weak photon emission. Frontiers in Physiology 6:241.DOI: 10.3389/fphys.2015.00241 · Open full text; historical review, not the original 1923 experiment. Used to describe the historical arrangement.
  3. Egon Lorenz (1934). Search for Mitogenetic Radiation by Means of the Photoelectric Method. Journal of General Physiology 17(6):843–862.DOI: 10.1085/jgp.17.6.843 · Publisher abstract verified; full-text scan also available at https://pmc.ncbi.nlm.nih.gov/articles/PMC2141317/.
  4. Alexander Hollaender (1939). The Present Status of Mitogenetic Radiation. Radiology 32(4):404–410.DOI: 10.1148/32.4.404 · Publisher abstract and metadata; contemporary review, not an additional experiment.
  5. W. S. Metcalf; T. I. Quickenden (1967). Mitogenetic Radiation. Nature 216:169–170.DOI: 10.1038/216169a0 · Publisher abstract and metadata verified. Historical perspective describes the negative 1930s work and renewed later interest; full text requires access.
  6. Bernard L. Strehler; William Arnold (1951). Light Production by Green Plants. Journal of General Physiology 34(6):809–820.DOI: 10.1085/jgp.34.6.809 · Open article abstract and full-text scan.
  7. Laura Colli; Ugo Facchini (1954). Light emission by germinating plants. Il Nuovo Cimento 12:150–153.DOI: 10.1007/BF02820374 · Publisher metadata verified; full text requires access. Methodological context corroborated by the 1955 follow-up and later scholarly histories.
  8. L. Colli; U. Facchini; G. Guidotti; R. Dugnani Lonati; M. Orsenigo; O. Sommariva (1955). Further measurements on the bioluminescence of the seedlings. Experientia 11:479–481.DOI: 10.1007/BF02166829 · Publisher metadata and original Italian summary verified; full text requires access. The historical term bioluminescence in this title refers to the reported faint seedling emission.
  9. R. C. Allen; R. L. Stjernholm; R. H. Steele (1972). Evidence for the generation of an electronic excitation state(s) in human polymorphonuclear leukocytes and its participation in bactericidal activity. Biochemical and Biophysical Research Communications 47(4):679–684.DOI: 10.1016/0006-291X(72)90545-1 · PubMed metadata verified. Original abstract available on an author-deposited copy at https://www.researchgate.net/publication/18143103_Evidence_of_the_generation_of_an_electronic_excitation_states_in_human_polymorphonuclear_leukocytes_and_its_participation_in_bactericidal_activity; publisher full text not accessed.
  10. T. I. Quickenden; S. S. Que Hee (1974). Weak luminescence from the yeast Saccharomyces cerevisiae and the existence of mitogenetic radiation. Biochemical and Biophysical Research Communications 60(2):764–770.DOI: 10.1016/0006-291X(74)90306-4 · Publisher abstract verified; full text requires access.
  11. A. Boveris; E. Cadenas; R. Reiter; M. Filipkowski; Y. Nakase; B. Chance (1980). Organ chemiluminescence: noninvasive assay for oxidative radical reactions. Proceedings of the National Academy of Sciences USA 77(1):347–351.DOI: 10.1073/pnas.77.1.347 · PubMed abstract verified; open full-text scan at https://pmc.ncbi.nlm.nih.gov/articles/PMC348267/.
  12. F. A. Popp; W. Nagl; K. H. Li; W. Scholz; O. Weingärtner; R. Wolf (1984). Biophoton emission. New evidence for coherence and DNA as source. Cell Biophysics 6:33–52.DOI: 10.1007/BF02788579 · Publisher abstract and metadata verified; full text requires access.
  13. Michal Cifra; Christian Brouder; Michaela Nerudová; Ondřej Kučera (2015). Biophotons, coherence and photocount statistics: A critical review. Journal of Luminescence 164:38–51.DOI: 10.1016/j.jlumin.2015.03.020 · Open author manuscript of the published critical review. Its conclusion is dated 2015, not an assertion that every later claim was assessed.
  14. R. N. Tilbury; T. I. Quickenden (1988). Spectral and time dependence studies of the ultra weak bioluminescence emitted by the bacterium Escherichia coli. Photochemistry and Photobiology 47(1):145–150.DOI: 10.1111/j.1751-1097.1988.tb02704.x · Publisher abstract and metadata verified; full text may require access.
  15. R. Q. Scott; M. Usa; H. Inaba (1989). Ultraweak emission imagery of mitosing soybeans. Applied Physics B 48:183–185.DOI: 10.1007/BF00692144 · Publisher abstract and author metadata verified directly; full text requires access. Some secondary reference lists omit M. Usa, but the publisher lists all three authors.
  16. M. Takeda, Y. Tanno, M. Kobayashi, M. Usa, N. Ohuchi, S. Satomi and H. Inaba (1998). A novel method of assessing carcinoma cell proliferation by biophoton emission. Cancer Letters 127(1–2), 155–160.DOI: 10.1016/S0304-3835(98)00064-0 · Primary abstract verified; full article not reviewed.
  17. Masaki Kobayashi, Motohiro Takeda, Tomoo Sato, Yoshihiko Yamazaki, Kenya Kaneko, Ken-Ichi Ito, Hiroshi Kato and Humio Inaba (1999). In vivo imaging of spontaneous ultraweak photon emission from a rat’s brain correlated with cerebral energy metabolism and oxidative stress. Neuroscience Research 34(2), 103–113.DOI: 10.1016/S0168-0102(99)00040-1 · Primary publisher abstract verified; full article not reviewed.
  18. Motohiro Takeda, Masaki Kobayashi, Mariko Takayama, Satoshi Suzuki, Takanori Ishida, Kohji Ohnuki, Takuya Moriya and Noriaki Ohuchi (2004). Biophoton detection as a novel technique for cancer imaging. Cancer Science 95(8), 656–661.DOI: 10.1111/j.1349-7006.2004.tb03325.x · Primary abstract and selected original paper text verified. PubMed journal issue is August2004; later online/PMC date should not replace publication year.
  19. Masaki Kobayashi, Daisuke Kikuchi and Hitoshi Okamura (2009). Imaging of Ultraweak Spontaneous Photon Emission from Human Body Displaying Diurnal Rhythm. PLOS ONE 4(7), e6256.DOI: 10.1371/journal.pone.0006256 · Open access; full primary text and figure captions verified.
  20. Ankush Prasad and Pavel Pospíšil (2011). Linoleic Acid-Induced Ultra-Weak Photon Emission from Chlamydomonas reinhardtii as a Tool for Monitoring of Lipid Peroxidation in the Cell Membranes. PLOS ONE 6(7), e22345.DOI: 10.1371/journal.pone.0022345 · Open access; full primary text, captions and license verified.
  21. Anshu Rastogi and Pavel Pospíšil (2011). Spontaneous ultraweak photon emission imaging of oxidative metabolic processes in human skin: effect of molecular oxygen and antioxidant defense system. Journal of Biomedical Optics 16(9), 096005.DOI: 10.1117/1.3616135 · Primary abstract verified; article is marked free, but image reuse permission not verified.
  22. John A. Ives, Eduard P. A. van Wijk, Namuun Bat, Cindy Crawford, Avi Walter, Wayne B. Jonas, Roeland van Wijk and Jan van der Greef (2014). Ultraweak Photon Emission as a Non-Invasive Health Assessment: A Systematic Review. PLOS ONE 9(2), e87401.DOI: 10.1371/journal.pone.0087401 · Open access; abstract, inclusion numbers and license verified from PubMed/PMC.
  23. Blake T. Dotta; Nirosha J. Murugan; Lukasz M. Karbowski; Robert M. Lafrenie; Michael A. Persinger (2014). Shifting wavelengths of ultraweak photon emissions from dying melanoma cells: their chemical enhancement and blocking are predicted by Cosic’s theory of resonant recognition model for macromolecules. Naturwissenschaften 101, 87–94.DOI: 10.1007/s00114-013-1133-3 · Publisher abstract and PubMed verified; subscription full text
  24. A. Shanei, Z. Alinasab, A. Kiani and M. A. Nematollahi (2017). Detection of Ultraweak Photon Emission (UPE) from Cells as a Tool for Pathological Studies. Journal of Biomedical Physics & Engineering 7(4), 389–396.Full primary text and license verified via Europe PMC XML; publication date December1,2017, not2018 despite later PubMed indexing. No DOI is present in archived article metadata.
  25. Rosilene Cristina Rossetto Burgos, Johannes Cornelius Schoeman, Lennart Jan van Winden, Kateřina Červinková, Rawi Ramautar, Eduard P. A. Van Wijk, Michal Cifra, Ruud Berger, Thomas Hankemeier and Jan van der Greef (2017). Ultra-weak photon emission as a dynamic tool for monitoring oxidative stress metabolism. Scientific Reports 7, 1229.DOI: 10.1038/s41598-017-01229-x · Open access; primary results, captions and CC BY4.0 license verified through publisher and Europe PMC XML.
  26. Nirosha J. Murugan; Nicolas Rouleau; Lukasz M. Karbowski; Michael A. Persinger (2018). Biophotonic markers of malignancy: Discriminating cancers using wavelength-specific biophotons. Biochemistry and Biophysics Reports 13, 7–11.DOI: 10.1016/j.bbrep.2017.11.001 · Full text verified through Europe PMC JATS
  27. Nirosha J. Murugan; Michael A. Persinger; Lukasz M. Karbowski; Blake T. Dotta (2020). Ultraweak Photon Emissions as a Non-Invasive, Early-Malignancy Detection Tool: An In Vitro and In Vivo Study. Cancers 12(4), 1001.DOI: 10.3390/cancers12041001 · Full text, methods, results and image license verified through Europe PMC JATS
  28. V. Salari, V. Seshan, L. Frankle, D. England, C. Simon and D. Oblak (2025). Imaging Ultraweak Photon Emission from Living and Dead Mice and from Plants under Stress. The Journal of Physical Chemistry Letters 16(17), 4354–4362.DOI: 10.1021/acs.jpclett.4c03546 · Peer-reviewed abstract verified; experimental detail cross-checked against the author preprint. Publisher Figshare deposit verified at https://acs.figshare.com/articles/journal_contribution/28855832 .
  29. Ankush Prasad, Eliška Mihačová, Renuka Ramalingam Manoharan and Pavel Pospíšil (2025). Application of ultra-weak photon emission imaging in plant stress assessment. Journal of Plant Research 138, 389–400.DOI: 10.1007/s10265-024-01600-w · Open access; full primary text, captions and CC BY4.0 license verified. Published January5,2025;2024 in DOI is not the publication year.
  30. Hayley Casey; Isabella DiBerardino; Mattia Bonzanni; Nicolas Rouleau; Nirosha J. Murugan (2025). Exploring ultraweak photon emissions as optical markers of brain activity. iScience 28(3), 112019.DOI: 10.1016/j.isci.2025.112019 · Full text, participant methods, limitations, authorship and license verified through Europe PMC JATS
  31. Luca De Paolis, Elisabetta Pace, Chiara Maria Mazzanti, Mariangela Morelli, Francesca Di Lorenzo, Lucio Tonello, Catalina Curceanu, Alberto Clozza, Maurizio Grandi, Ivan Davoli, Angelo Gemignani, Paolo Grigolini and Maurizio Benfatto (2026). First Experimental Measurements of Biophotons from Astrocytes and Glioblastoma Cell Cultures. Entropy 28(1), 112.DOI: 10.3390/e28010112 · Primary full text, methods, tables and license verified via Europe PMC XML; publication January17,2026.
  32. Jo Marchant (2026). All living things emit a faint glow. Could this light be useful?. Nature 655, 1116–1119 · News Feature.DOI: 10.1038/d41586-026-02311-z · Published July 28, 2026; corrected July 30. Publisher title, introductory text and bibliography verified. Full feature may require a subscription. Science journalism, not a primary experimental paper.
Scientific image creditsProvenance & reuse +

V1.1 illustrations combine AI-assisted scientific line art with source-linked comparison labels. Each explanatory drawing is specific to its milestone; original paper figures remain unchanged. Illustrations explain experimental designs and concepts, rather than reproduce measured images or exact historical hardware.

Living systems · Nature feature companion

Original AI-assisted editorial illustration created for the HelioFlux timeline. Fine-line human, plant and cell forms include soft light accents illustrating ultraweak emission. This is not Nature’s commissioned artwork or a research figure.

Accompanying Nature news feature ↗

Human photon imaging · 2009

Human photon emission changes through the day. In five healthy men, 20-minute exposures revealed a signal that varied with time of day. Figure 1 · Original paper ↗© 2009 Kobayashi, Kikuchi and Okamura · CC BY · Reproduced unaltered · 2085 × 2884 px

Publisher image file ↗

Three mouse-study groups · 2020

Mice received live melanoma cells, UV-killed melanoma cells, or no injection. These controls help distinguish tumor-associated changes from effects of injecting cells. Figure 1 · Original paper ↗© 2020 Murugan and colleagues · CC BY 4.0 · Reproduced unaltered · 3585 × 1777 px

Publisher image file ↗

Mouse-group photon counts · 2020

Mean raw photon counts per second in three mouse groups. Both injected groups changed over time; brightness alone did not uniquely identify tumor-bearing mice. Bars show group means with standard errors. Figure 5 · Original paper ↗© 2020 Murugan and colleagues · CC BY 4.0 · Reproduced unaltered · 3059 × 1973 px

Publisher image file ↗

Algal photon emission and lipid oxidation · 2011

A–D compare intact and disrupted algae, with and without added linoleic acid. Emission is strongest in disrupted cells with added fatty acid (D). E is an ordinary photograph. Figure 1 · Original paper ↗© 2011 Ankush Prasad and Pavel Pospíšil · CC BY · Reproduced unaltered · 1791 × 2142 px

Publisher image file ↗

Visualizing plant stress · 2025

Ordinary photographs sit beside 30-minute photon images of plants under baseline, oxidative, salt and heat conditions. False colors encode photon intensity. Figure 2 · Original paper ↗© 2024 Ankush Prasad, Eliška Mihačová, Renuka Ramalingam Manoharan and Pavel Pospíšil; published 2025 · CC BY 4.0 · Reproduced unaltered · 2740 × 4929 px

Publisher image file ↗

Brain-cell culture signals above background · 2026

Both cell cultures had higher average counts than detector background. Starting cell numbers differed, so the two cultures are not a like-for-like brightness comparison. Figure 2 · Original paper ↗© 2026 Luca De Paolis and colleagues · CC BY 4.0 · Reproduced unaltered · 3205 × 953 px

Publisher image file ↗

Two sides of one root. A reported difference.

Explanatory composition using an AI-generated root model and source-linked comparison labels. Gurwitsch compared opposite sides of the same receiving root and reported more cell division on the side facing its neighbor.

Underlying scientific source ↗

An early test found no detectable signal

Source-linked explanatory illustration created for this page. Lorenz detected no mitogenetic radiation from the tested sources within his method’s sensitivity and spectral conditions.

Underlying scientific source ↗

Plants keep emitting after illumination stops

Source-linked explanatory illustration created for this page. Previously illuminated plants emitted delayed light linked to photosynthetic chemistry.

Underlying scientific source ↗

Faint plant light becomes directly measurable

Source-linked explanatory illustration created for this page. Photoelectric measurements established weak visible emission from germinating plants as a physical signal.

Underlying scientific source ↗

Active immune cells emit measurable light

Source-linked explanatory illustration created for this page. Isolated human immune cells produced chemiluminescence while engulfing targets.

Underlying scientific source ↗

Yeast light changes with the growth stage

Source-linked explanatory illustration created for this page. Yeast cultures showed different emission patterns during late logarithmic and early stationary growth.

Underlying scientific source ↗

Oxidative reactions increase liver emission

Source-linked explanatory illustration created for this page. Hydroperoxide treatment increased light from rat liver preparations, supporting an oxidative chemical origin.

Underlying scientific source ↗

Popp proposed an organized-light model

Source-linked explanatory illustration created for this page. Popp interpreted optical observations through a DNA-related coherence model; the interpretation remains distinct from measuring UPE.

Underlying scientific source ↗

Bacterial emission depends on oxygen

Source-linked explanatory illustration created for this page. E. coli cultures emitted detectable light with oxygen but not without it under the tested conditions; wavelengths also varied with growth stage.

Underlying scientific source ↗

Images reveal where plant light originates

Source-linked explanatory illustration created for this page. Photon-counting images of germinating plants showed strongest emission in regions of active cell division.

Underlying scientific source ↗

Cancer-cell culture light tracks cell growth

Source-linked explanatory illustration created for this page. In TE9 carcinoma cultures, emission followed a time course similar to growth and was strongly influenced by cell number.

Underlying scientific source ↗

Brain light responds to energy metabolism

Source-linked explanatory illustration created for this page. Rat-brain imaging and separate brain-slice interventions linked emission with physiology and energy metabolism.

Underlying scientific source ↗

Mouse tumor light reflects growth and viability

Source-linked explanatory illustration created for this page. Emission patterns from transplanted mouse tumors were linked with tumor growth and microscopic tissue viability.

Underlying scientific source ↗

Human UPE research spans many studies

Source-linked explanatory illustration created for this page. The 2014 systematic review included 56 human studies with varied methods and study designs.

Underlying scientific source ↗

The wavelength signature changed over time

Source-linked explanatory illustration created for this page. Stressed melanoma cultures emitted different wavelength bands as the experiment progressed.

Underlying scientific source ↗

Measured emission and coherence are different claims

Source-linked explanatory illustration created for this page. The 2015 critical review accepted UPE as established but found reliable evidence for coherence or nonclassical light lacking.

Underlying scientific source ↗

Oxidative stress increases light in HT-29 cells

Source-linked explanatory illustration created for this page. Hydrogen-peroxide exposure increased emission in cultured HT-29 colon-cancer cells, with dose- and time-dependent responses.

Underlying scientific source ↗

Photon signals track oxidative metabolism

Source-linked explanatory illustration created for this page. In differentiated HL-60 cells, optical and metabolic changes were linked; blocking NADPH oxidase reduced induced emission.

Underlying scientific source ↗

Wavelength information improved cell-group separation

Source-linked explanatory illustration created for this page. Selected wavelength bands separated the study’s cultured-cell groups better than unfiltered photon counts.

Underlying scientific source ↗

Biological state changes whole-animal emission

Source-linked explanatory illustration created for this page. In the 2025 mouse experiment, living animals emitted more light than the measurements taken after euthanasia.

Underlying scientific source ↗

Electrical activity and near-head light were recorded together

Source-linked explanatory illustration created for this page. Some photon-count patterns correlated with EEG activity in this exploratory study; the light’s tissue of origin remains unresolved.

Underlying scientific source ↗
How to read this historyScope & evidence boundaries +

A curated history, not a census of every paper

This timeline selects historically influential work, direct measurements, mechanism studies and relevant newer directions through September 2026. Original reports take priority; historical reviews supply context where older full text is unavailable. An abstract-only source is labeled. Inclusion is not a claim of consensus, replication or equal evidence strength.

Different kinds of light are not interchangeable

Spontaneous UPE is distinct from bright, specialized bioluminescence, externally excited fluorescence, light remaining after illumination (delayed luminescence), and infrared thermal radiation. Related methods are labeled where included. Detection alone does not demonstrate cell-to-cell communication, a coherent light field or quantum information processing.

Results belong to their experimental setting

Cell-line discrimination is not patient diagnostic accuracy. An animal group difference is not individual cancer detection. Healthy-human near-head photon measurements do not validate cancer screening. Related regeneration and mechanosensing papers demonstrate broader scientific work, not direct UPE evidence.

Figures and illustrations

Original paper figures retain their panels, scales and authors’ credits. False colors encode measured intensity. Explanatory illustrations show the experiment or idea, with their scientific sources linked below; creation details are listed in the image credits. Restricted-rights figures are linked rather than reproduced.

Scope

No institution or publisher is presented as endorsing HelioFlux.

Scientific figure